
In a DevOps environment, you have to deal with a lot of different internal services that have their own authentication systems. This can take a lot of time and work to provision correctly, especially as part of user onboarding and offboarding. Tailscale already knows who you are, so for tools that you only make internally accessible in your tailnet, such as Grafana (a popular observability/statistics graphing service), we can take advantage of that to lighten the load. Instead of relying on each application to have its own authentication, by putting the application available in your tailnet, you can control access based on the existing identities and authentication you have in your identity provider. You can then manage access to that service with the authorization controls you define in Tailscale ACLs.
This post will assume the following things:
- You have administrative (
sudo) access to the target machine - You have HTTPS enabled for your tailnet (your-tailscale-https-domain.ts.net refers to the randomly generated domain names that Tailscale HTTPS uses)
- You have created a Tailscale auth key with an ACL tag
Even though this post focuses on Grafana, you can use this basic technique for other tools too.
How This Works
Every Tailscale client (specifically the tailscaled daemon) has a local API
server available. Using the whois call in this API enables you to identify the
owner of IP addresses in your tailnet.
$ curl --unix-socket /var/run/tailscale/tailscaled.sock http://tailscaled/localapi/v0/whois'?addr=100.127.23.80:42313'
{
        "Node": {
                …
        },
        "UserProfile": {
                "ID": 56317844550325451,
                "LoginName": "xe@tailscale.com",
                "DisplayName": "Xe Iaso",
                "ProfilePicURL": "https://lh3.googleusercontent.com/a-/AOh14Gh35ftnYCLGiCW6iaZZ-9L8hGC0Ho6p6ISu1VB_=s96-c",
                "Roles": []
        }
}
The most important part of this output is is the UserProfile object. It contains my name, my email address, my Tailscale user ID, and my profile picture URL. We can use this along with Grafana’s Auth Proxy authentication method to integrate our two worlds.
Grafana Configuration
Let’s configure Grafana to allow this. If you don’t already have Grafana installed on your machine, please refer to this guide by DigitalOcean on how to install Grafana.
Once you have Grafana installed, you will need to open its configuration file in
a text editor (such as vim):
sudo $EDITOR /etc/grafana/grafana.ini
Then you will need to change the following settings:
- In the
[server]section, make the following changes:- Make sure you have HTTPS enabled
- Change
domaintografana.your-tailscale-https-domain.ts.net - Change the
root_urlsetting tohttps://grafana.your-tailscale-https-domain.ts.net
- Make the
[auth.proxy]section look like this:
[auth.proxy]
enabled = true
header_name = X-WebAuth-User
header_property = username
auto_sign_up = true
sync_ttl = 60
whitelist = 127.0.0.1
headers = Name:X-WebAuth-Name
enable_login_token = true
The ability to arbitrarily tell Grafana who you are is a powerful one, and it
can allow attackers to claim to be a superuser if they guess the right username
and email address. By setting the whitelist setting to 127.0.0.1, you only
allow connections from the Grafana authentication proxy to be able to bypass
Grafana’s normal authentication mechanisms. This ensures that attackers can’t
connect to Grafana without the proxy and then claim to be someone else.
Restart Grafana with systemctl:
sudo systemctl restart grafana-server
Installing the Auth Proxy
We have made our internal Grafana auth proxy available in our GitHub repository. It is a standard Go program. Here are the steps to install it:
- Install the Go compiler toolchain (you will need at least version 1.18)
- Install the
proxy-to-grafanaprogram:
go install tailscale.com/cmd/proxy-to-grafana@latest
sudo install $HOME/go/bin/proxy-to-grafana /usr/local/sbin/proxy-to-grafana
- Copy the following template into
/etc/default/proxy-to-grafana(this file may need to be put in/etc/sysconfigon some distributions, I am using the path that was present in Ubuntu 20.04):
TS_AUTHKEY=ts-hunter2-hunter2hunter2
TS_HOSTNAME=grafana
GRAFANA_ADDR=127.0.0.1:3000
- Generate a new one-time authkey in the admin console
- Put that authkey into the
TS_AUTHKEYvariable - Change the
TS_HOSTNAMEandGRAFANA_ADDRvariables as needed - Put this into a new file at
/etc/systemd/system/proxy-to-grafana.service:
[Unit]
Description=Tailscale Authentication Proxy for Grafana
ConditionPathExists=/etc/default/proxy-to-grafana

[Service]
DynamicUser=yes
EnvironmentFile=/etc/default/proxy-to-grafana
Restart=on-failure
RuntimeDirectory=proxy-to-grafana
RuntimeDirectoryMode=0700
StateDirectory=proxy-to-grafana
StateDirectoryMode=0700
CacheDirectory=proxy-to-grafana
CacheDirectoryMode=0700
ExecStart=/usr/local/sbin/proxy-to-grafana --use-https=true --hostname=$TS_HOSTNAME --backend-addr=$GRAFANA_ADDR

[Install]
WantedBy=multi-user.target
- Activate the service:
sudo systemctl daemon-reload
sudo systemctl enable --now proxy-to-grafana.service
Finally, check the admin console and wait for a node named grafana (or whatever you set
the TS_HOSTNAME variable to) to show up. If it doesn’t show up, use the
following command to see what’s going on:
sudo systemctl status proxy-to-grafana.service
You can view detailed logs with this command:
sudo journalctl -feu proxy-to-grafana.service
Then open https://grafana.your-tailscale-https-domain.ts.net in your browser (the first load may take a moment or two while the proxy is getting a certificate from Let’s Encrypt, but it will be fast after that) and take a look at the username in the lower right corner of the screen:
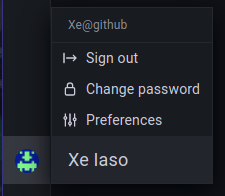
It worked! All you have to do is connect to Grafana in your tailnet, and Grafana will already know who you are!
Locking Down Grafana
Now we can proceed to locking down Grafana so that all access can only happen over Tailscale:
In the Grafana server configuration screens, grant your newly created account admin powers. This is needed because when we set up the HTTPS proxy we will be unable to access the Grafana login page again. If you do not give a Tailscale user admin powers then you will have locked yourself out of admin powers. Be sure to grant admin access in the following areas:
- At the server level
- At the grafana organization level
Then open /etc/grafana/grafana.ini and change http_addr in the [server]
section to 127.0.0.1. This will make Grafana only listen on localhost. Restart
Grafana with sudo systemctl restart grafana-server and then refresh your
browser to ensure things are still working.
Get Connected
Grafana is a commonly used service you may want to integrate in this way; but this basic technique can work with any number of other services, custom admin tools and just about anything that you can configure to read user information over HTTP headers. The source code of our proxy is in GitHub, and it is easy to copy and extend for more use cases.
If you make anything cool using this, please let us know at @Tailscale on twitter or on our forum. The cloud’s the limit!
 Xe Iaso


