Picture this. It’s 3am. And your server's root filesystem just filled up. Web requests continue being served, so you don’t notice immediately. But eventually, the CMS needs to write to disk and suddenly the whole house of cards comes crashing down. You’re scrambling.
“What’s broken now?” you ask. Hoping that speaking these words into the keyboard in front of you will reveal some answers. Alas.
You reach for SSH. “Phew,” you think. You can still SSH into the remote system to poke around and figure out what’s going on. 10 minutes later you’ve finally figured out what went wrong—find some caches to clear out or a log file to purge. Reboot. And we’re back, people!
This whole mess could have been avoided with a proper monitoring system in place. Many solutions exist in this space ranging from large complex, full featured solutions like netdata, Prometheus, Grafana, Telegraf, InfluxDB, and many, many others. Sometimes though, all you want is a small, simple lightweight agent running on each host reporting back some basic metrics like temperatures, disk usage percentages, and the like.
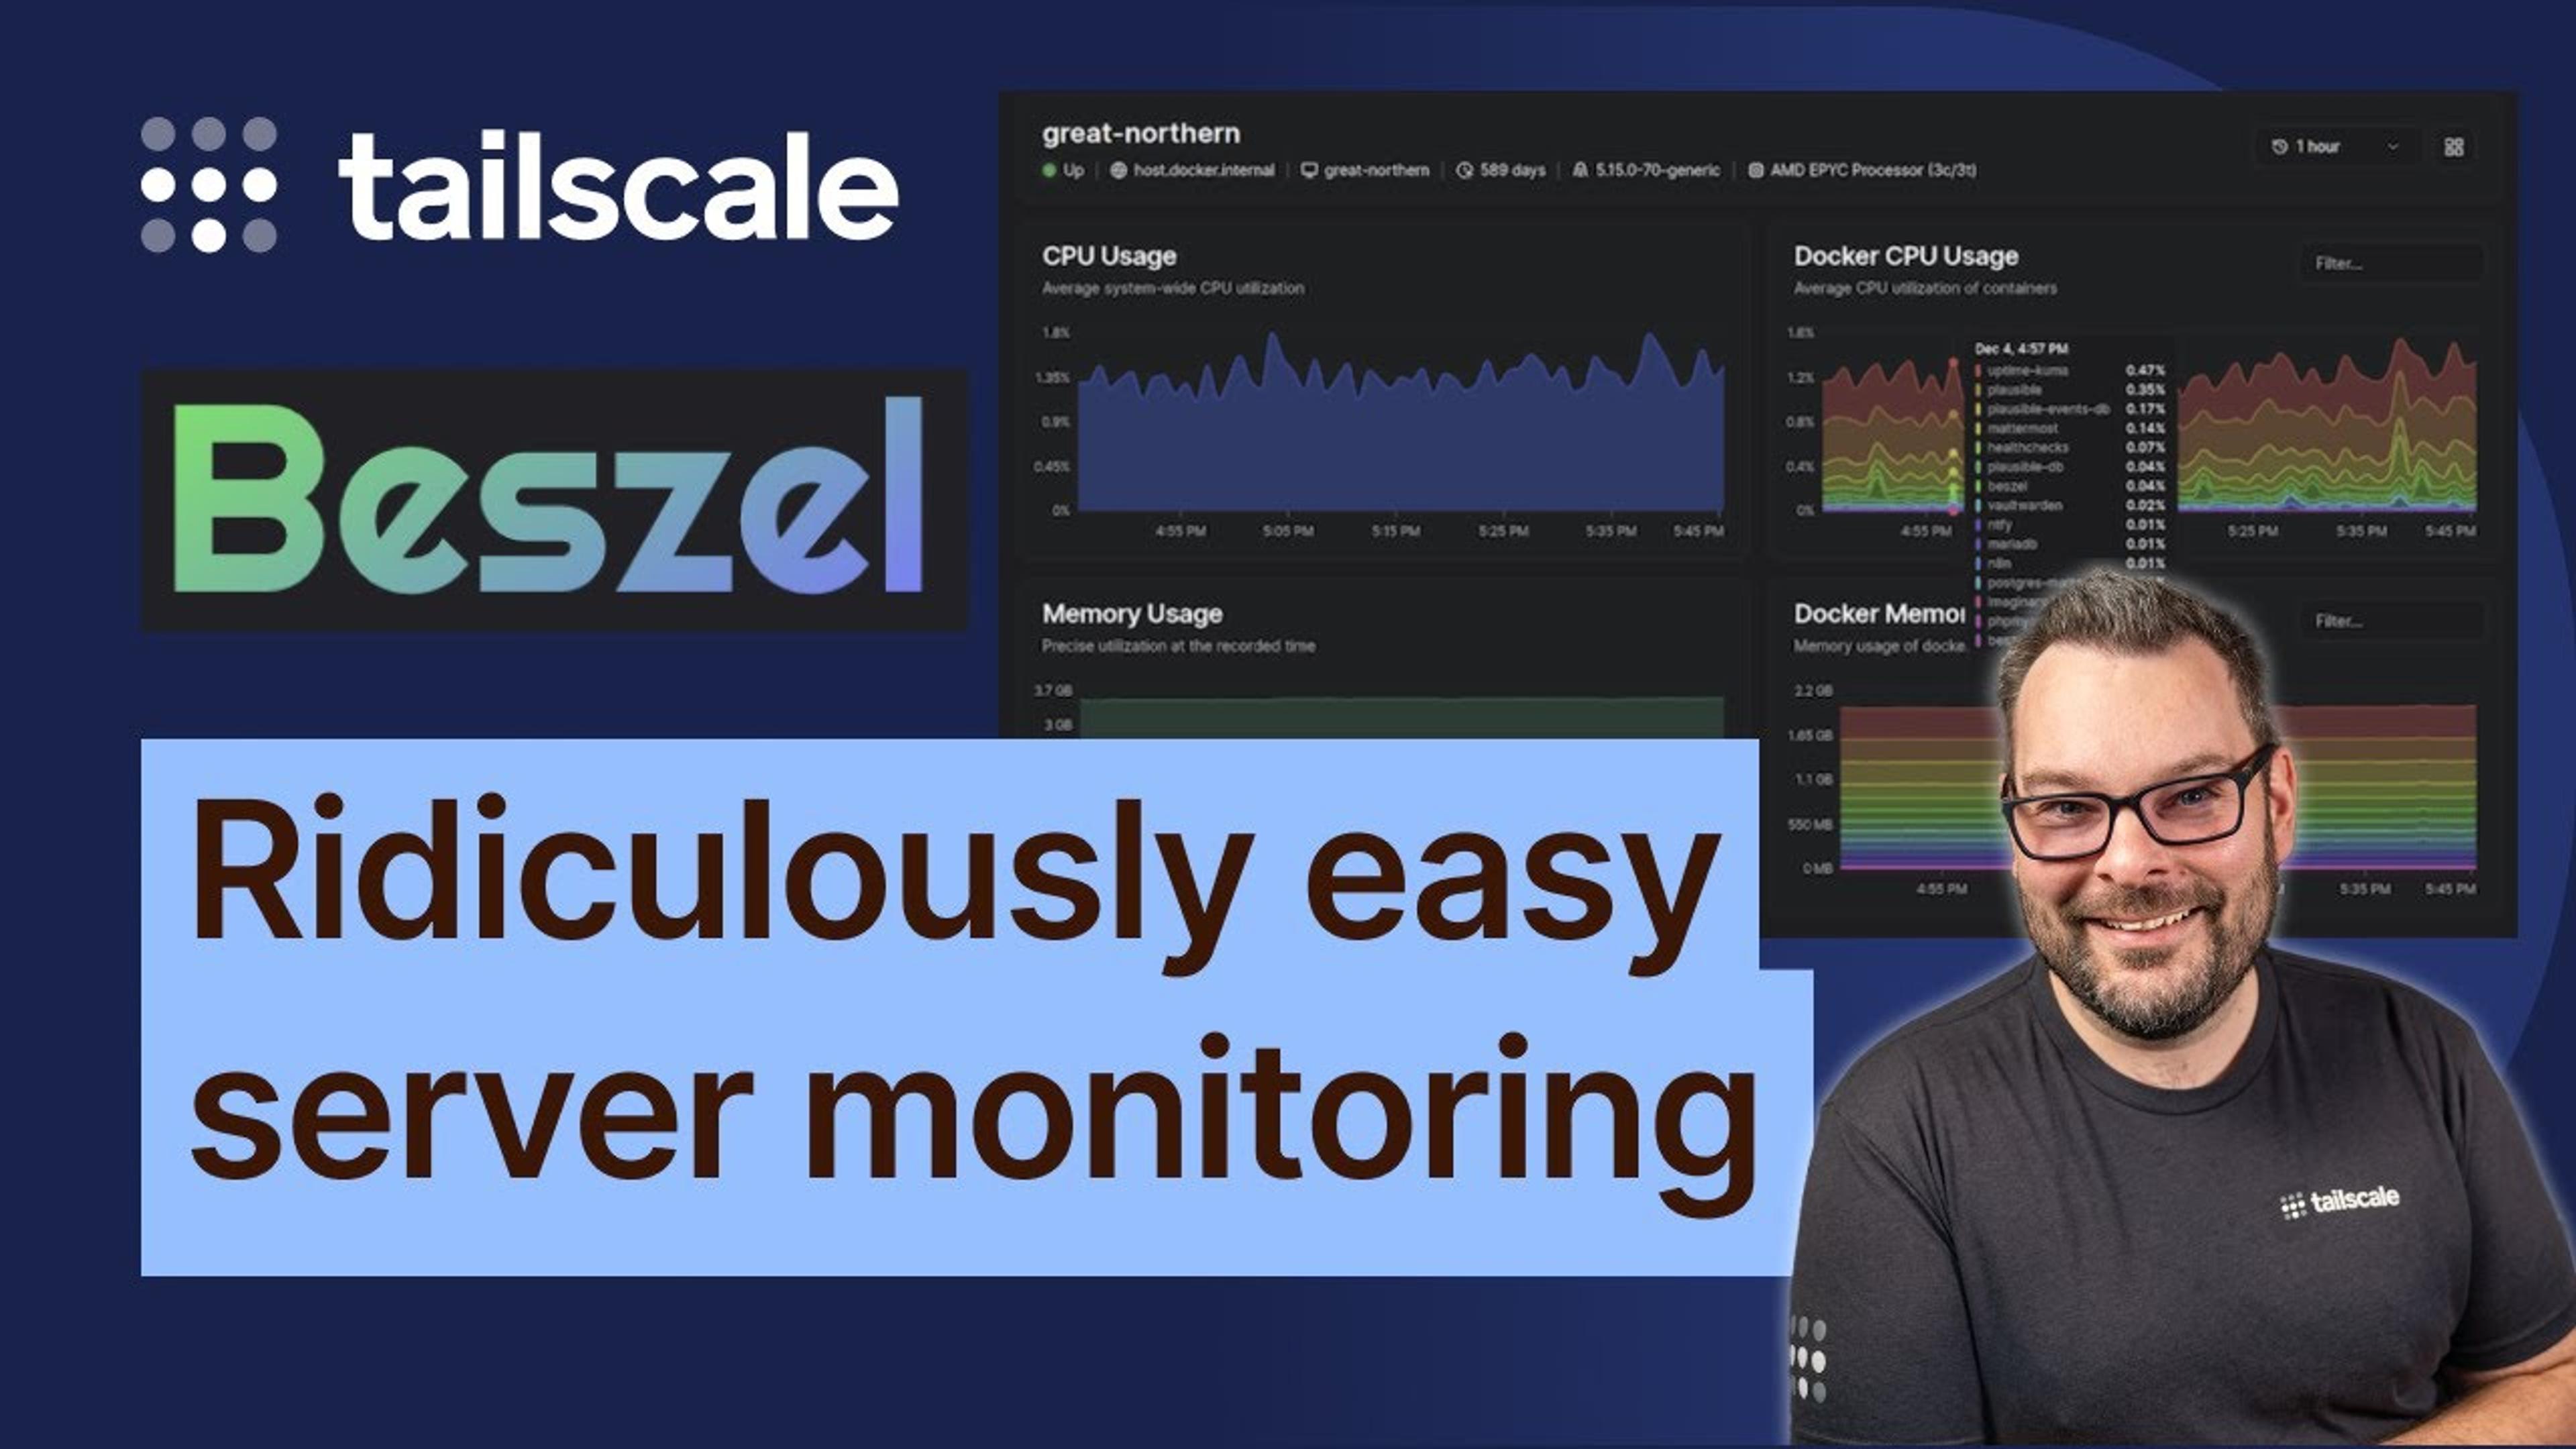
Enter Beszel. A simple, lightweight monitoring tool for your servers. It runs in docker or as a Go binary on your hosts. In today’s video, I walk through the process of setting up Beszel as a monitoring solution for devices on your Tailscale network.
Running Beszel is straightforward on Linux using docker or systemd. It also runs on Macs as a service using launchd. But Windows presented a more unique challenge as the agent isn’t designed to run as a native Windows service—I’ve written a separate blog post covering all the Windows details. Perfect for an easy GPU monitoring solution, whether you’re running video games or at the latest AI models with Ollama.
Being able to add any host to your monitoring solution, anywhere in the world from your tailnet is a perfect example of why building your network around Tailscale makes networking simple.
If you’re a monitoring maniac, keep an eye on our YouTube channel for an upcoming video about the new Tailscale client metrics feature that allows you to scrape metrics directly into Prometheus.

 Alex Kretzschmar


