Network administrators can now monitor devices in their Tailscale network using Prometheus and our new client metrics feature, which provides connection data in a standard and ingestible format. That combination brings enterprise-grade visibility to your Tailscale network, or tailnet, making it easy to track performance, spot trends, and set up alerts.
Our latest video shows how it works. You can enable metrics on any Tailscale node with the command tailscale set --webclient. This exposes a /metrics endpoint that's compatible with Prometheus, so you can start collecting data right away.
I walk you through the entire process step by step in the video embedded below and available on our YouTube channel. Supporting code snippets, as always, are on GitHub.
Monitoring is a hot topic for many of our users. In a recent video we talked about Beszel, a lightweight monitoring tool. If you're ready to dive into the deep end of network monitoring, Prometheus offers a much more comprehensive solution. By exposing metrics from Tailscale clients and scraping them into Prometheus, administrators can gain valuable insights into their network's performance and health.
What's particularly powerful about this setup is the ability to monitor specific patterns in your tailnet traffic. For instance, if you're running subnet routers and users report slowdowns, you can now track performance metrics and set up alerts through Prometheus's Alert Manager when certain thresholds are exceeded. This proactive monitoring approach can help you identify and address issues before they impact your users.
Since your Prometheus service is part of your tailnet in this configuration, it can reach out to every node on your network to collect metrics. Tailscale's built-in DNS system makes the setup process much simpler than traditional network monitoring solutions.
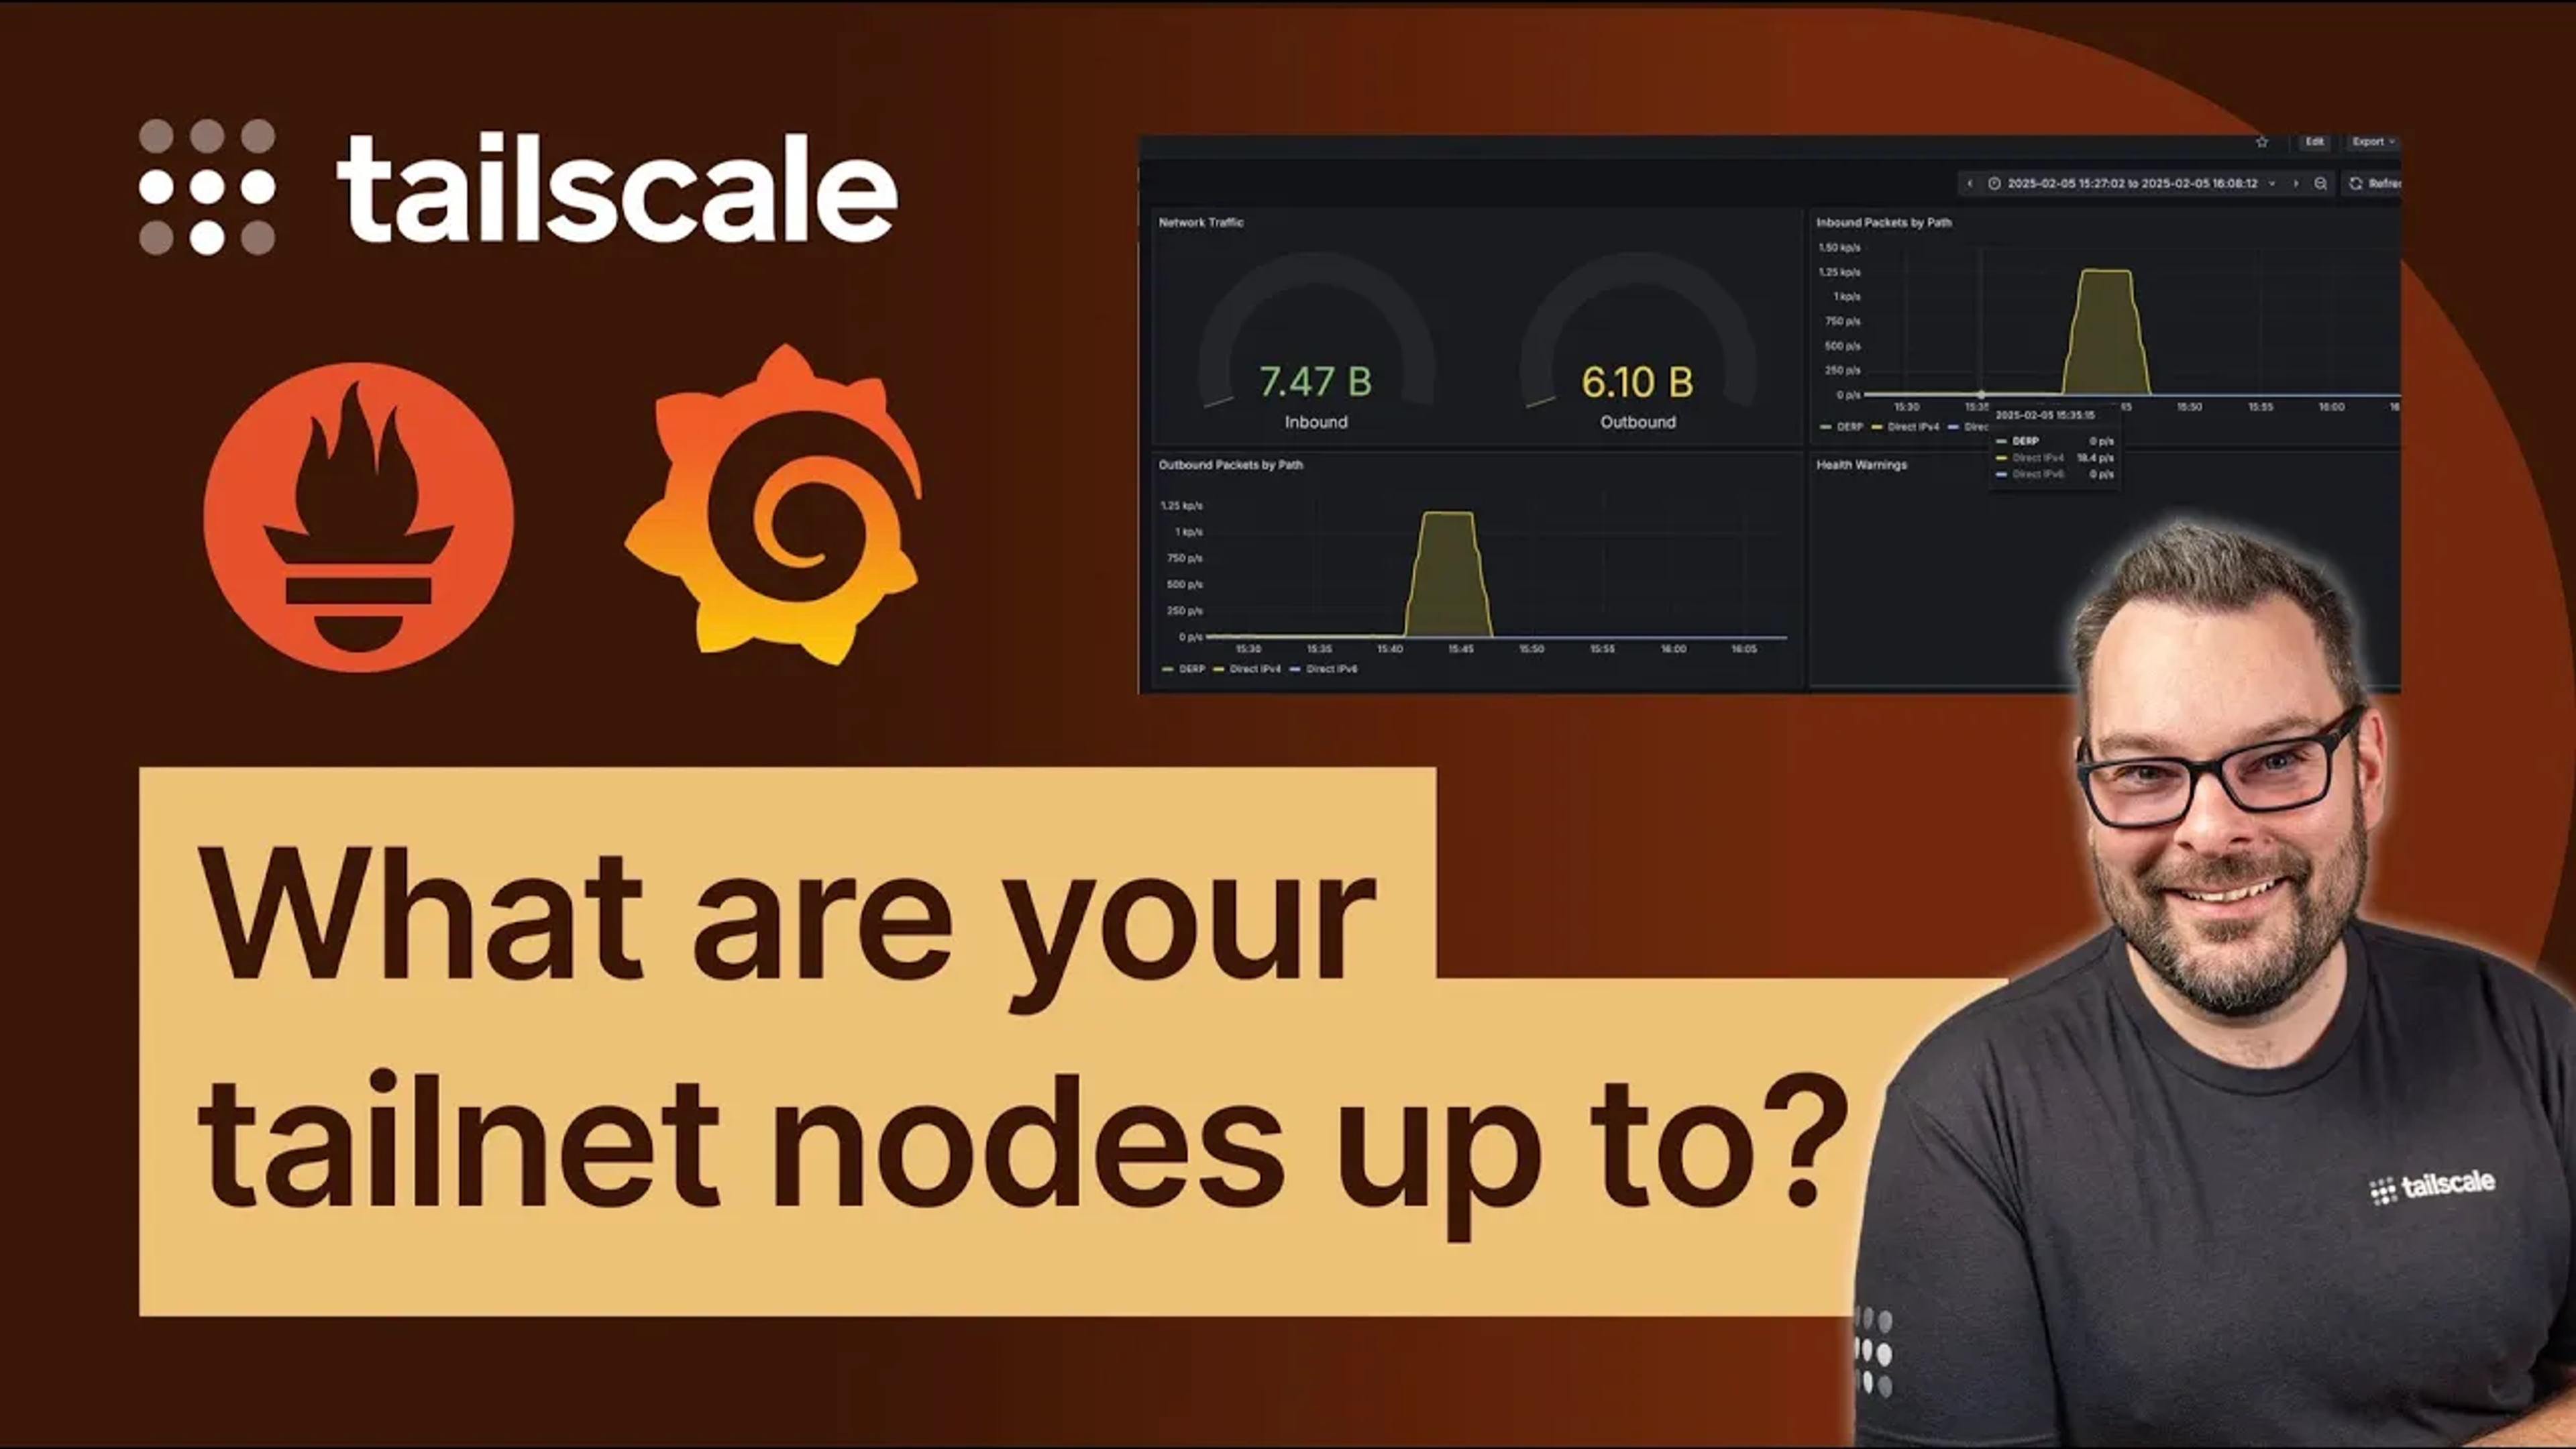
Prometheus makes creating visualizations in Grafana easy too. After all, who doesn’t love a good graph? They make it easy to spot trends and anomalies, plus you can easily track everything from direct IPv4/IPv6 packets to DERP server usage, giving you a comprehensive view of your network's behavior.
Whether you're managing a small tailnet or a large enterprise deployment, these new monitoring capabilities provide valuable insights into your network's performance. Ready to get started? Learn more about making the switch to Tailscale.
 Alex Kretzschmar


