Securely connecting your critical internal data sources to monitoring tools is a notoriously tricky task for developer and operations teams. While platforms like Grafana Cloud provide the flexibility and power you need, exposing private data sources to the public internet, and moving that data between agents, SSH tunnels, and proxies, adds complexity and risk.
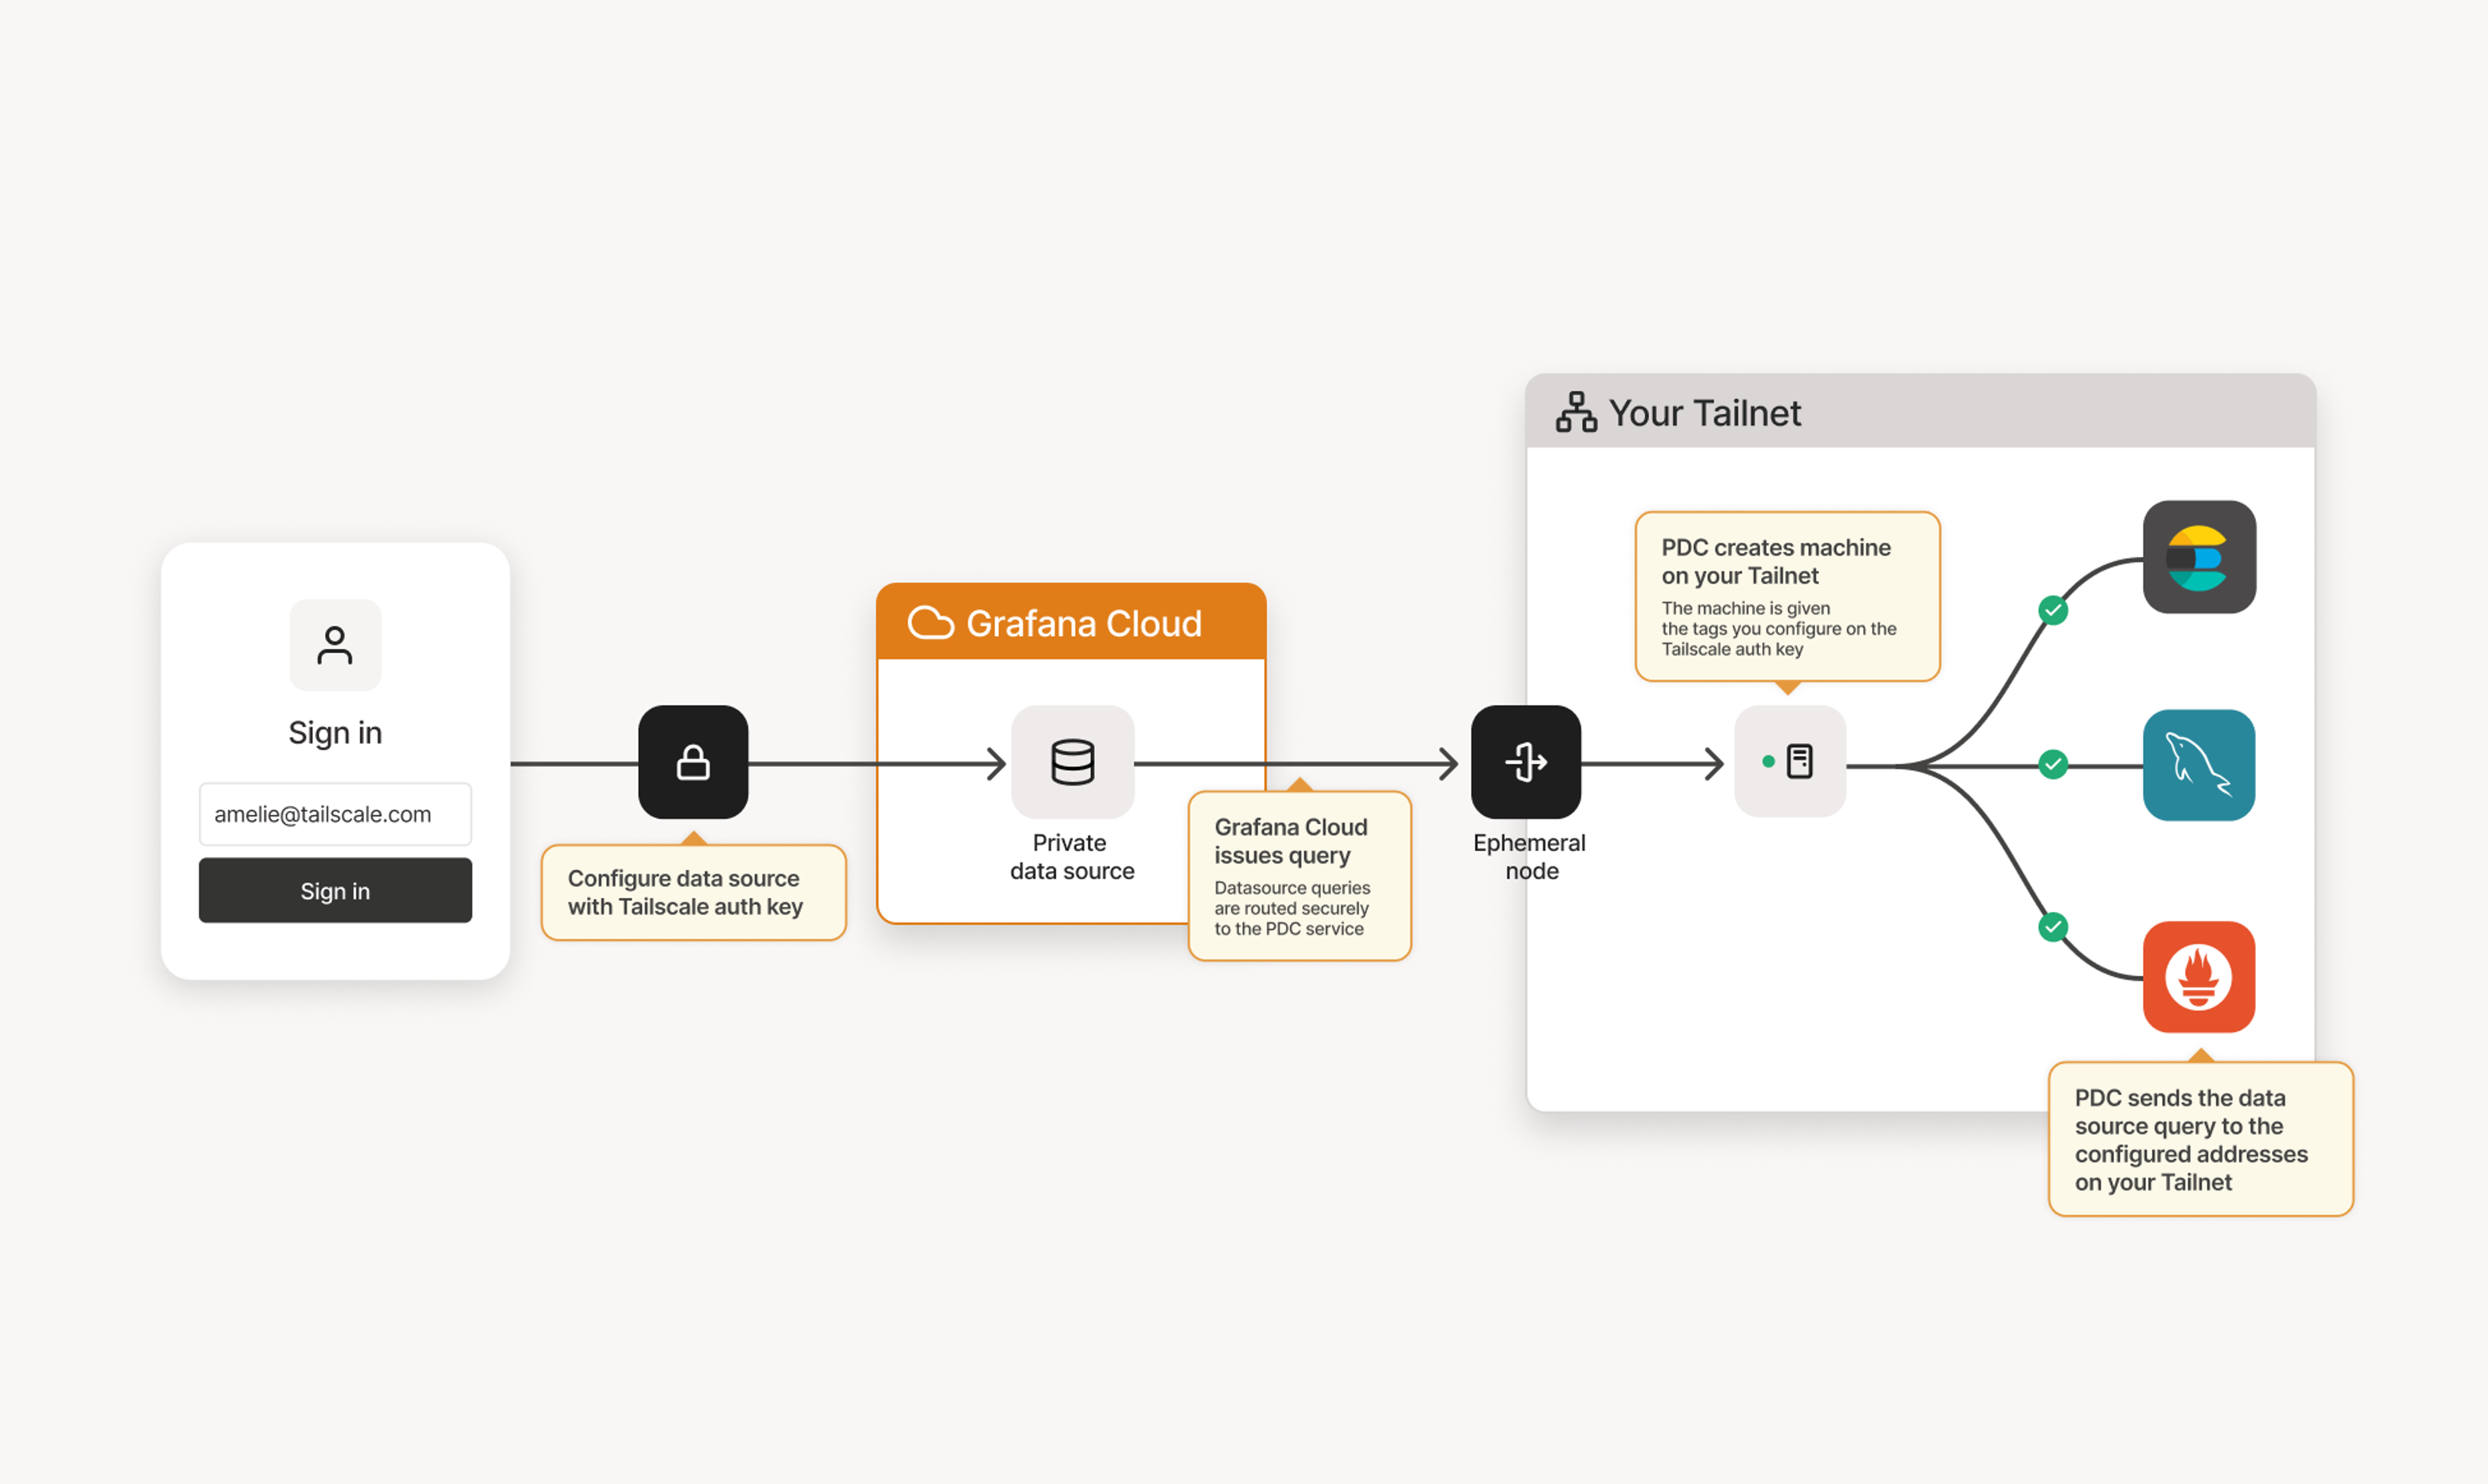
That's why Grafana Labs and Tailscale have partnered on a new integration that lets you securely connect data sources inside your tailnet directly to your Grafana Cloud stack, without exposing those data sources on the public internet. Using Private data source connect (PDC), Grafana Cloud can securely query private data sources over your tailnet, with no exposed ports, no proxies, and no SSH tunnels. Your data remains private and remotely accessible via Grafana Cloud’s powerful visualization tools.
Under the hood, Grafana Cloud temporarily joins your Tailnet as an ephemeral node scoped by your access controls. You configure access using Tailscale tags, and data sources are reachable via MagicDNS, making it seamless to connect Prometheus or other tools without exposing anything publicly.
By combining Tailscale’s security and ease of use with Grafana Cloud’s fully managed observability platform, you get a simpler, safer way to monitor your infrastructure. It's a perfect fit for teams that want to stay flexible and keep their data private, without resorting to traditional networking workarounds. Your dashboards and the data they run on will travel with you, wherever you happen to be working, with no need for public IPs or exposed ports.
This integration, developed by Grafana Labs, is currently in private preview. You can read more about it at Grafana Labs' blog. If you run private infrastructure and want a simpler, more secure way to connect to Grafana Cloud, sign up through this form, and Grafana Labs will reach out with onboarding details.
 Smriti Sharma


