

Tailscale’s integration with Datadog is now Generally Available, bringing much-requested support for the observability industry leader as a native streaming destination for your Tailscale logs. Customers can now send Tailscale logs (audit logs and network flow logs) directly to Datadog and use its out of the box (OOB) visualization and alerting capabilities to monitor the health of their tailnets. This includes monitoring changes to sensitive settings, looking for anomalous traffic patterns, gaining insight into how traffic flows through the tailnet and more. In this post, we will show how you can use Tailscale’s integration with Datadog to:
- Visualize flow of traffic in your tailnet
- Configure our recommended monitors to receive useful alerts
Visualize network flow logs in Datadog
Once you’ve configured streaming for network flow logs into Datadog, you can use the out of the box (OOB) dashboard to analyze the flow of traffic in your tailnet. Keep in mind that there may be a minor delay between when you configure streaming and when they start appearing in Datadog.
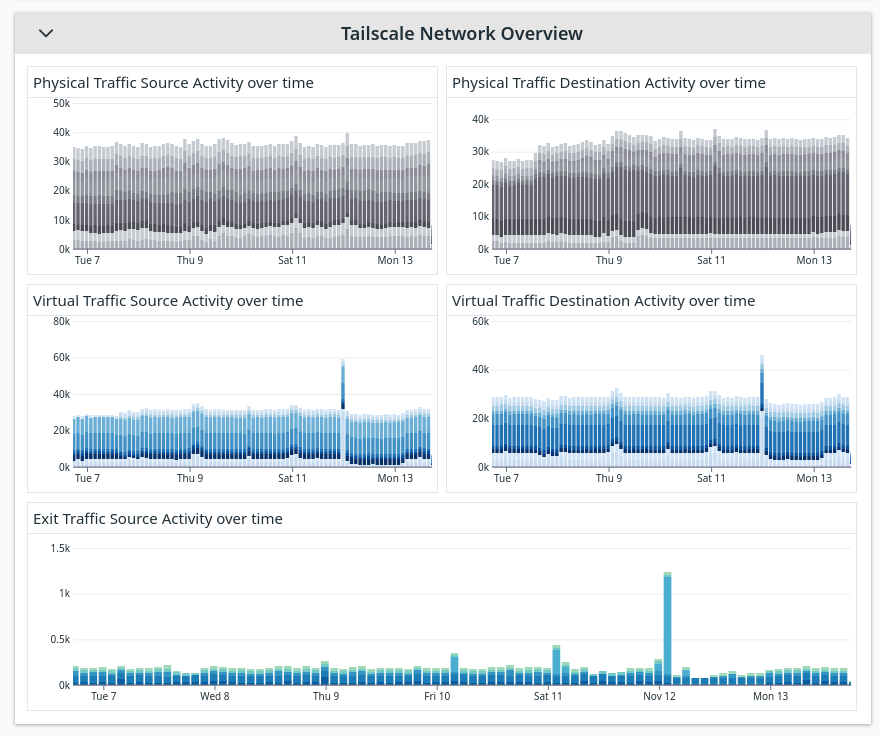
You can leverage insights on the OOB dashboard to understand how much traffic is flowing through your tailnet in any given period of time and drill down to specific IPs, ports, or even devices that are sending/receiving traffic. This single pane of glass view can be used to give you insights into:
- Traffic patterns
- Potential security threats
- Forensic analysis of security event
- Possible performance issues
Let’s imagine that you noticed a higher than usual traffic volume via port 22 which indicates potential file transfer via the SSH port. You can use the OOB dashboard to drill down to specific IPs and/or devices that are responsible for this traffic pattern and investigate further about the nature of this transfer.
Configure our recommended monitors to receive useful alerts
Datadog’s Tailscale integration comes with pre-configured monitors to generate alerts when it detects potential sensitive changes or anomalous traffic patterns. Its traffic monitor will alert you if the traffic over a specific port and/or IP goes beyond a certain threshold. You can also set up a monitor for changes to your tailnet including when user/devices approvals are disabled, when logs are disabled and more—we’ve got a full list of events that you can configure alerts for.
Check out Datadog’s announcement for more information about the integration with Tailscale, or read our log streaming documentation.
Ready to try log streaming now? Get started right on your admin console .
 Pouyan Aminian


