Tailscale makes secure, identity-based networking simple — but as your tailnet grows, understanding traffic flow can get tricky. That’s why we encourage building on top of Tailscale, like Raj Singh, a Customer Success Engineer at Tailscale, did with TSFlow: a real-time network visualizer that turns your Tailscale logs into interactive, actionable insights, for customers on our Premium and Enterprise plans.
Visualizing your Tailscale network traffic with TSFlow

Ever stared at network logs at 2 AM, trying to figure out why your API suddenly got slow? You're not alone. While Tailscale makes secure networking beautifully simple, understanding what's actually happening across your tailnet as it grows can feel like reading tea leaves.
That's exactly the problem I faced as a Customer Success Engineer at Tailscale. I kept hearing from customers who loved how easy Tailscale made networking but struggled to visualize their traffic patterns. So I built TSFlow: a real-time network visualizer that transforms your Tailscale logs into the kind of interactive insights you actually want to look at.
The problem: Network logs aren't exactly... visual
Tailscale's identity-based networking is incredibly powerful, but as your tailnet grows, the question "what's actually happening on my network?" becomes harder to answer. Push a new ACL configuration to 200 devices, and good luck figuring out if it's working as intended by staring at raw logs.
Here's what I kept hearing from customers:
“I deployed new access controls last week, but I have no idea if they're actually blocking the traffic I intended.”
“Our API response times are terrible, but I can't tell which devices are hammering our database servers.”
“My security team wants to see network segmentation for our compliance audit, but all I have are text logs.”
Sound familiar? TSFlow solves exactly these problems by turning your Tailscale network flow logs into something beautiful and actionable.
Why existing tools fall short
Traditional network monitoring tools were built for a different era—when networks had clear perimeters and fixed IP addresses. They're not designed for the dynamic, identity-based networks that Tailscale enables.
You've probably tried using them and hit these frustrations:
- Complex setup: Requires dedicated infrastructure and specialized knowledge
- Poor integration: Doesn't understand Tailscale's device identity model
- Overwhelming data: Shows everything but highlights nothing important
- No real-time insight: Historical dashboards don't help during active incidents
We needed something purpose-built for the Tailscale ecosystem—something that understands your devices, respects your ACLs, and shows you exactly what you need to know, when you need to know it.
Meet TSFlow: Network visualization that actually makes sense
TSFlow transforms your Tailscale network flow logs into visualizations that make you say, "Oh, that's what's happening on my network." Built with a clean Go backend and modern React frontend, it's designed to feel familiar to anyone who's used modern web applications. Available on our Premium and Enterprise plans, if you manage a large network of nodes - TSFlow could be a vital part of your planning and network visualization toolkit.
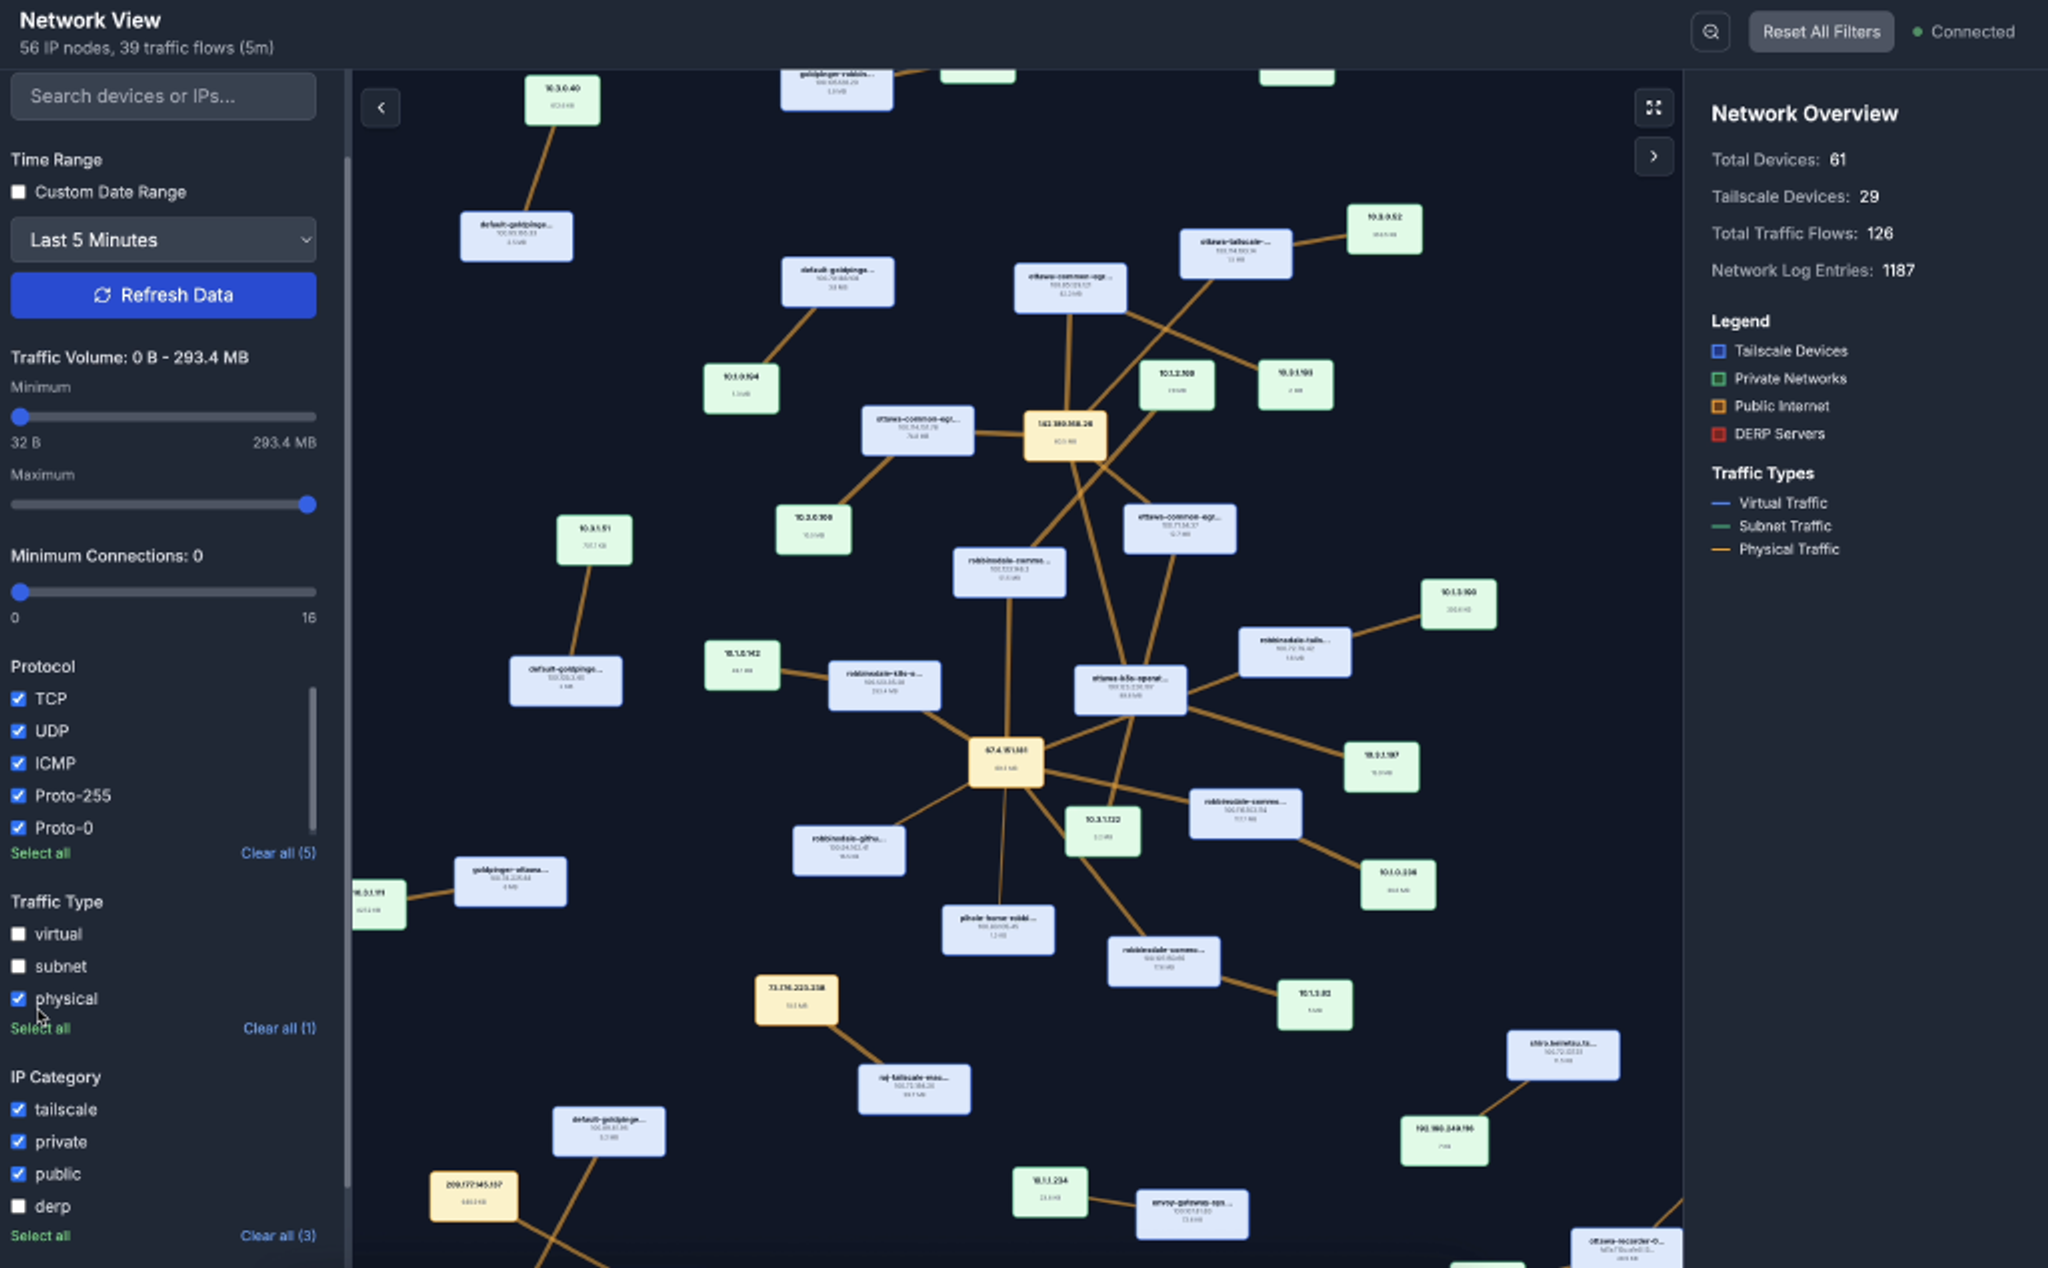
Your network topology, alive and interactive
Remember those network diagrams you drew on whiteboards? TSFlow makes them real and interactive:
- Force-directed graphs that show how your devices actually relate to each other
- Real-time traffic animations so you can watch data flow as it happens
- Multiple layout options (force-directed, circular, grid, hierarchical) because everyone thinks about networks differently
- Zoom and pan controls for when you need to dive deep into complex topologies
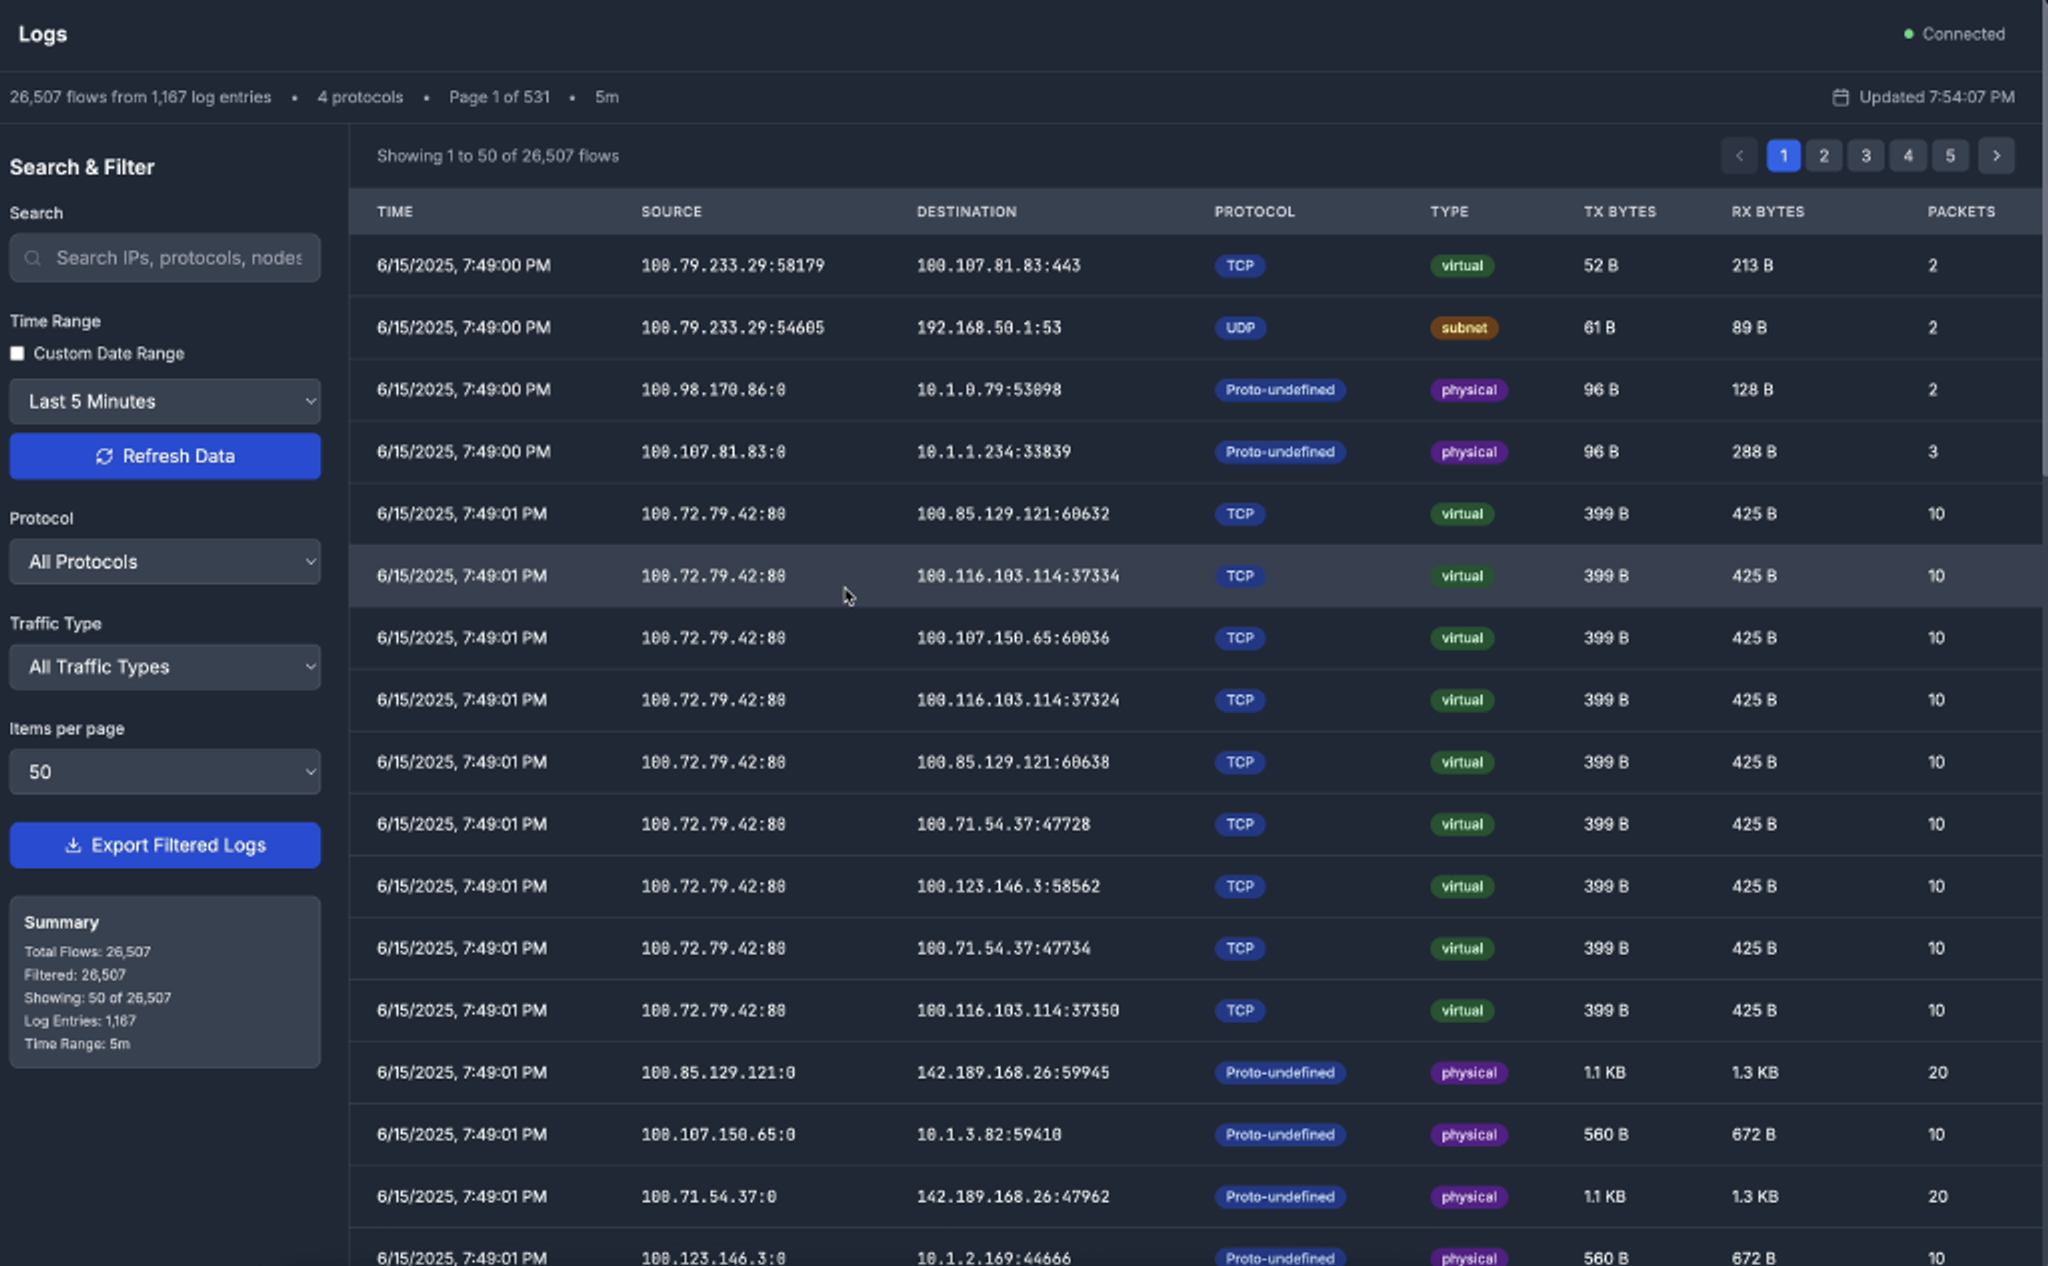
Analytics that answer your actual questions
No more squinting at log files. TSFlow's analytics dashboard shows:
- Live traffic metrics and bandwidth utilization across your tailnet
- Protocol breakdown (TCP, UDP, ICMP) with statistics that actually matter
- Device activity monitoring so you know what's online, offline, and in between
- Historical trends with customizable time ranges
Filtering that finds the needle in the haystack
Whether you're hunting down a performance issue or investigating unusual traffic:
- Flexible time ranges from "show me the last 5 minutes" to custom date ranges
- Protocol filtering to focus on exactly the traffic type you care about
- Traffic categorization (virtual, subnet, physical) matching your network structure
- Device and tag-based filtering that aligns with your existing Tailscale organization
Real-world problems TSFlow can help with today
ACL verification that just works
Deploying ACL changes with Tailscale usually means hoping you got it right. TSFlow eliminates the guesswork by giving DevOps teams immediate visibility into which connections are allowed or blocked—right in the network topology view.
Quickly pinpoint performance bottlenecks
Seeing unexpected latency or slow API responses? TSFlow's bandwidth visualizations can highlight traffic patterns—like CI/CD jobs routing through a costly region—in seconds, instead of spending hours digging through logs.
Security insights without a PhD
Unusual device-to-device communication or unexpected traffic spikes? TSFlow's live network view makes it easy to spot security anomalies and investigate them before they become issues.
Accelerated onboarding with living documentation
Instead of static network diagrams, teams use TSFlow to show exactly how their services are connected. New engineers can explore the network in real-time and understand where their services fit from day one.
Get started
TSFlow integrates effortlessly into your existing Tailscale environment — no extra infrastructure, complicated configurations, or advanced networking knowledge required.
For details on using TSFlow with your account (Premium or Enterprise plan required), visit the TSFlow GitHub page.
Note:
While TSFlow was created by a Tailscale employee, it has been open-sourced in the spirit of community collaboration, similar to other Tailscale community projects. We're sharing it to be helpful, but please note that it's a community-maintained project and not officially supported by Tailscale.
Share
Author
 Raj Singh
Loading...


