How to provide secure remote access to Grafana dashboards
Grafana dashboards help you monitor apps and information that are critical to your company. In this tutorial, you will learn how to securely connect to Grafana dashboards without needing complex firewalls or compromising security.
No matter what type of application you’re working on, being able to examine metrics that capture how your systems are performing offers many advantages. Whether it’s simple metrics, such as CPU and RAM usage, or more advanced metrics, like mean time between failures, metrics will always be helpful in understanding and troubleshooting any piece of software.
There are many tools for collecting these types of metrics, but just collecting them is not enough. You also need to make sure they are presented in a consumable way for your workflows. For this, many engineers opt to use Grafana. Grafana is an observability platform that offers advanced dashboards and supports a variety of data sources. You can create as many dashboards as you like, including variable-based ones, allowing each team to see exactly what they need to know.
Why you need secure remote access
When using Grafana, you’ll likely come across situations where you want to share information about your metrics with people both inside and outside of your organization. For example, if you’re a B2B company, you may want to share reliability metrics with potential clients. Or if you’re working with a consultancy firm, you may want to share some relevant dashboards with them. Any time you share your service, however, it’s important to limit each person’s access to only those resources within Grafana that they need to see — and nothing else.
Sometimes default configurations for services like Grafana open access more widely than is strictly required. What you likely want to do is follow the principle of least privilege. You should never give more access to anything than what it needs to perform its job. For example, Grafana should only be able to read metrics from your application — it shouldn’t be able to change environment variables. Similarly, anyone in your organization who doesn’t need to have access to service metrics should not have access to Grafana dashboards.
In this article, you’ll be introduced to two ways of securing Grafana access: Using inlets, which is a tool that creates a tunnel between your private resources and the public internet, and using Tailscale, which works by creating a private network that you then access using the Tailscale client.
Utilizing inlets
The first way we’ll try implementing secure remote access to your Grafana dashboard is with inlets. inlets works by letting you expose local resources to the public internet via a tunnel. In a production setup, Grafana would likely be running on a server that you don’t want to make publicly accessible — for example, if the machine has other sensitive services running, such as a database, that should never be exposed outside of your local network. Using an inlets tunnel, you can make just your Grafana dashboards accessible from the public internet, leaving all other services running on the machine still unreachable from the internet. And inlets provides a variety of tools to help protect your tunnel from unwanted activity.
To make an inlets tunnel work, you must set up a server that has a public IP that can accept traffic for your private Grafana instance. There are many cloud provider options to create a public server. For this tutorial, we’ll be using DigitalOcean.
Once we set up your private Grafana instance and your cloud-hosted server with a public IP to route through, we’ll use inletsctl to create the tunnel between them. Once this is done, you can access the IP of your public machine (or the domain name, if you’ve set up a DNS record), and the traffic will be forwarded to Grafana running on your local network.
To get this done, you first need to install the inletsctl CLI:
$ curl -sLSf https://inletsctl.inlets.dev | sudo shinlets requires you to be on their Pro version to set up live tunnels, as inletsctl will actually spin up a DigitalOcean Droplet for you. Download inlets Pro by running the following command:
$ sudo inletsctl download --proNow that both tools have been installed, you’re ready to get started creating your tunnel. Deploy your Grafana instance locally using Docker:
$ docker run -d -p 3000:3000 \
  --name grafana \
  grafana/grafana:latest
This will start Grafana in a detached Docker container, accessible on port 3000. Test this by going to localhost:3000 in your browser. If you’re not seeing the login screen for Grafana at this point, wait a minute or two to make sure your Docker container is fully initialized; otherwise, check out Grafana’s troubleshooting guide. Once you have Grafana running, it’s time to create the public DigitalOcean server.
The first step in creating a public server is to create a DigitalOcean access token and save it to a file on your local machine called do-access-token.txt.
With that step done, run the following command and inletsctl will deploy a Droplet in DigitalOcean that will act as your public server:
$ inletsctl create \
 --region lon1 \
 --provider digitalocean \
 --access-token-file do-access-token.txt \
 --letsencrypt-domain grafana.example.com \
 --letsencrypt-email person@example.com
You should also make sure to replace --letsencrypt-domain and --letsencrypt-email with your own information. Check out Let’s Encrypt for more information on how to set this up.
When the command is done, you should see an output resembling the following:
...
inlets PRO HTTPS (0.9.3) server summary:
  IP: 167.99.85.122
  HTTPS Domains: [grafana.siig.tech]
  Auth-token: <token>

Command:

# Obtain a license at https://inlets.dev
# Store it at $HOME/.inlets/LICENSE or use --help for more options

# Where to route traffic from the inlets server
export UPSTREAM="http://127.0.0.1:8000"

inlets-pro http client --url "wss://167.99.85.122:8123" \
--token "<token>" \
--upstream $UPSTREAM

To delete:
  inletsctl delete --provider digitalocean --id "<inlets-id>"
An important thing to note here, as you can see in the terminal output, is that you will have to obtain a license in order to complete the following steps. With the license acquired, change the port in the UPSTREAM variable to 3000, as that is the port Grafana is running on. Now you just need to copy the two commands from the output, and inlets Pro will create the tunnel so that you can access your Grafana instance.
Now your Grafana instance is publicly accessible over the tunnel via :3000. If you’d rather use a human-readable name than IPs for access, you can create a DNS record for your service.
You can now share your Grafana instance with others without giving them access to the entire internal machine it’s running on. But it’s important to keep in mind that because it is accessible on the public internet, anyone with the link can access it. We recommend that you look into Grafana’s built-in user account management tools to ensure only authorized users can log into the system.
An important thing to note about how inlets works is that the tunnel you’ve created using the inlets-pro http client ... command has to stay open while you’re using it. Be aware that inlets sets a cap on the number of tunnels you can have, with the basic version only giving you two tunnels.
Utilizing Tailscale
Another option for setting up secure access to Grafana is with Tailscale. Tailscale has a different approach than inlets. Instead of making Grafana available to the public internet, with Tailscale, you create a private network to manage user access with only a few clicks. Once the network is enabled, each device you add to your network will get a private Tailscale IP address, regardless of where it’s located. Then you can access your services just like you would if they were on your local network, while in reality they can be anywhere in the world, such as on an AWS instance somewhere across the globe.
To showcase how Tailscale works, you’ll be deploying Grafana on Heroku. To follow along with this tutorial, you’ll need to have a Heroku account and a Tailscale account. With both of these accounts created, you’re ready to deploy Grafana.
To do this, there’s a GitHub repo with an easy Deploy to Heroku button for Tailscale. This will take you to Heroku to deploy a private Grafana server that is only accessible over Tailscale.
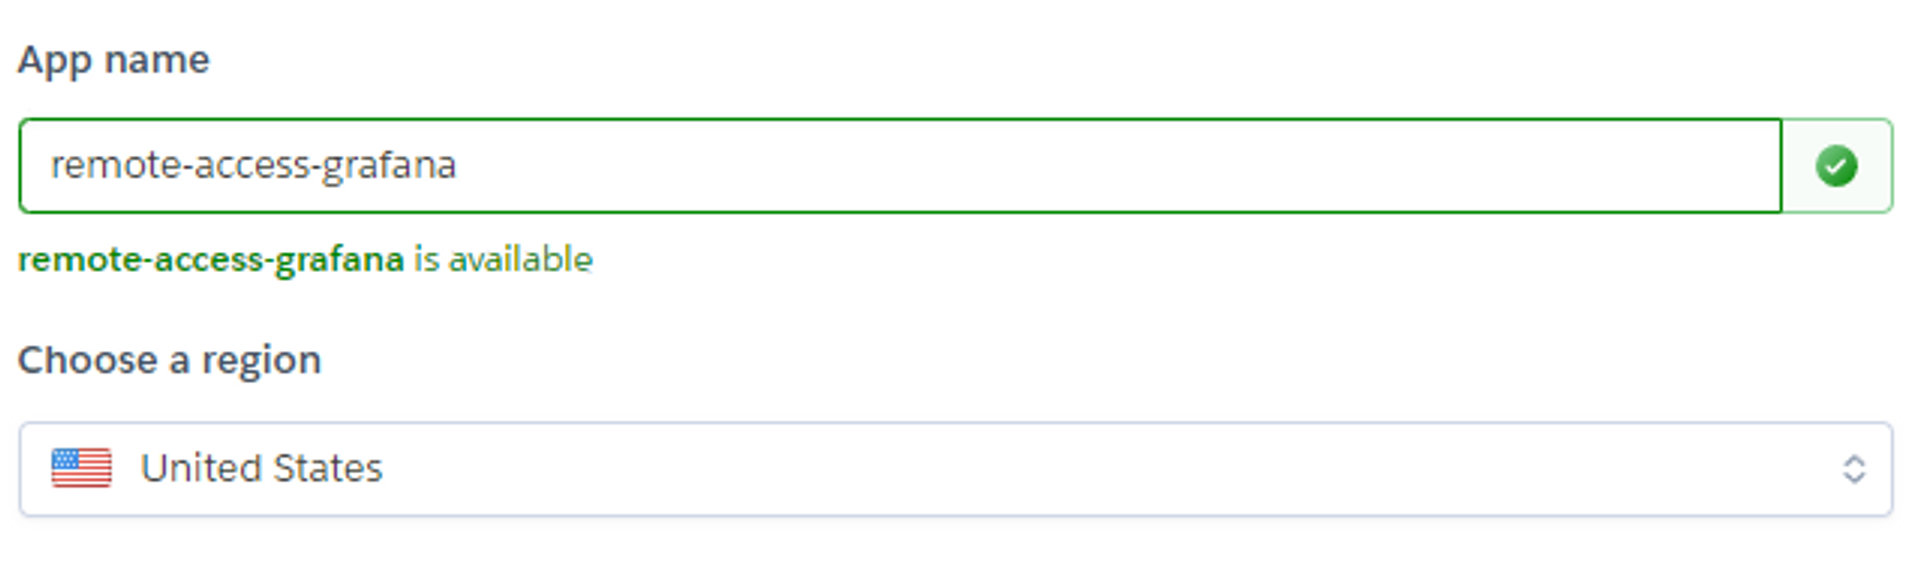
To start, you need to give your application a name and set a location where you want it to live:
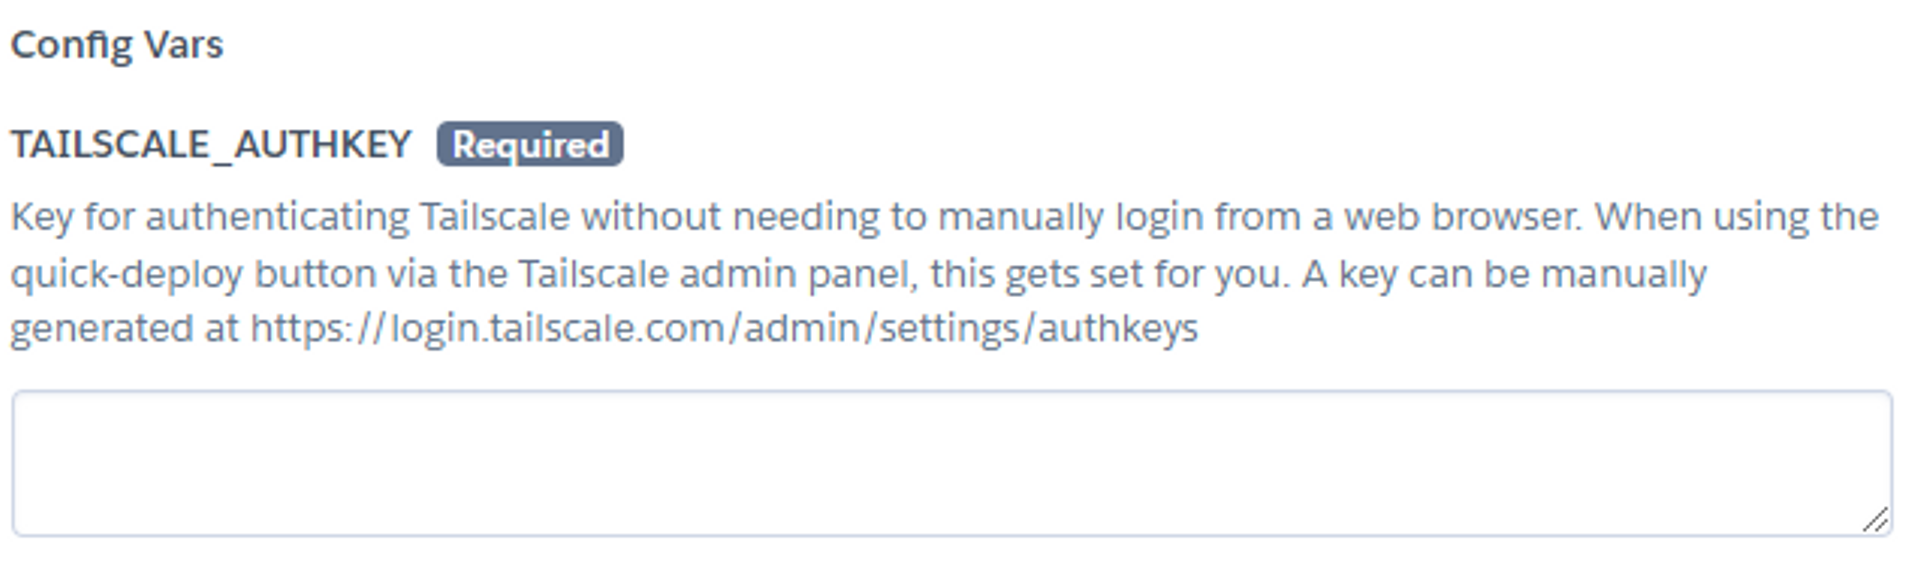
Next, scroll to the bottom and enter your TAILSCALE_AUTHKEY. This will authenticate Grafana to your Tailscale network. If you don’t already have an auth key, you can create one via the Tailscale admin console.
Now, click Deploy App, and in a minute or so, Grafana will be deployed. Once it’s fully configured, you can go to your admin dashboard and see that Tailscale manages your Grafana instance:
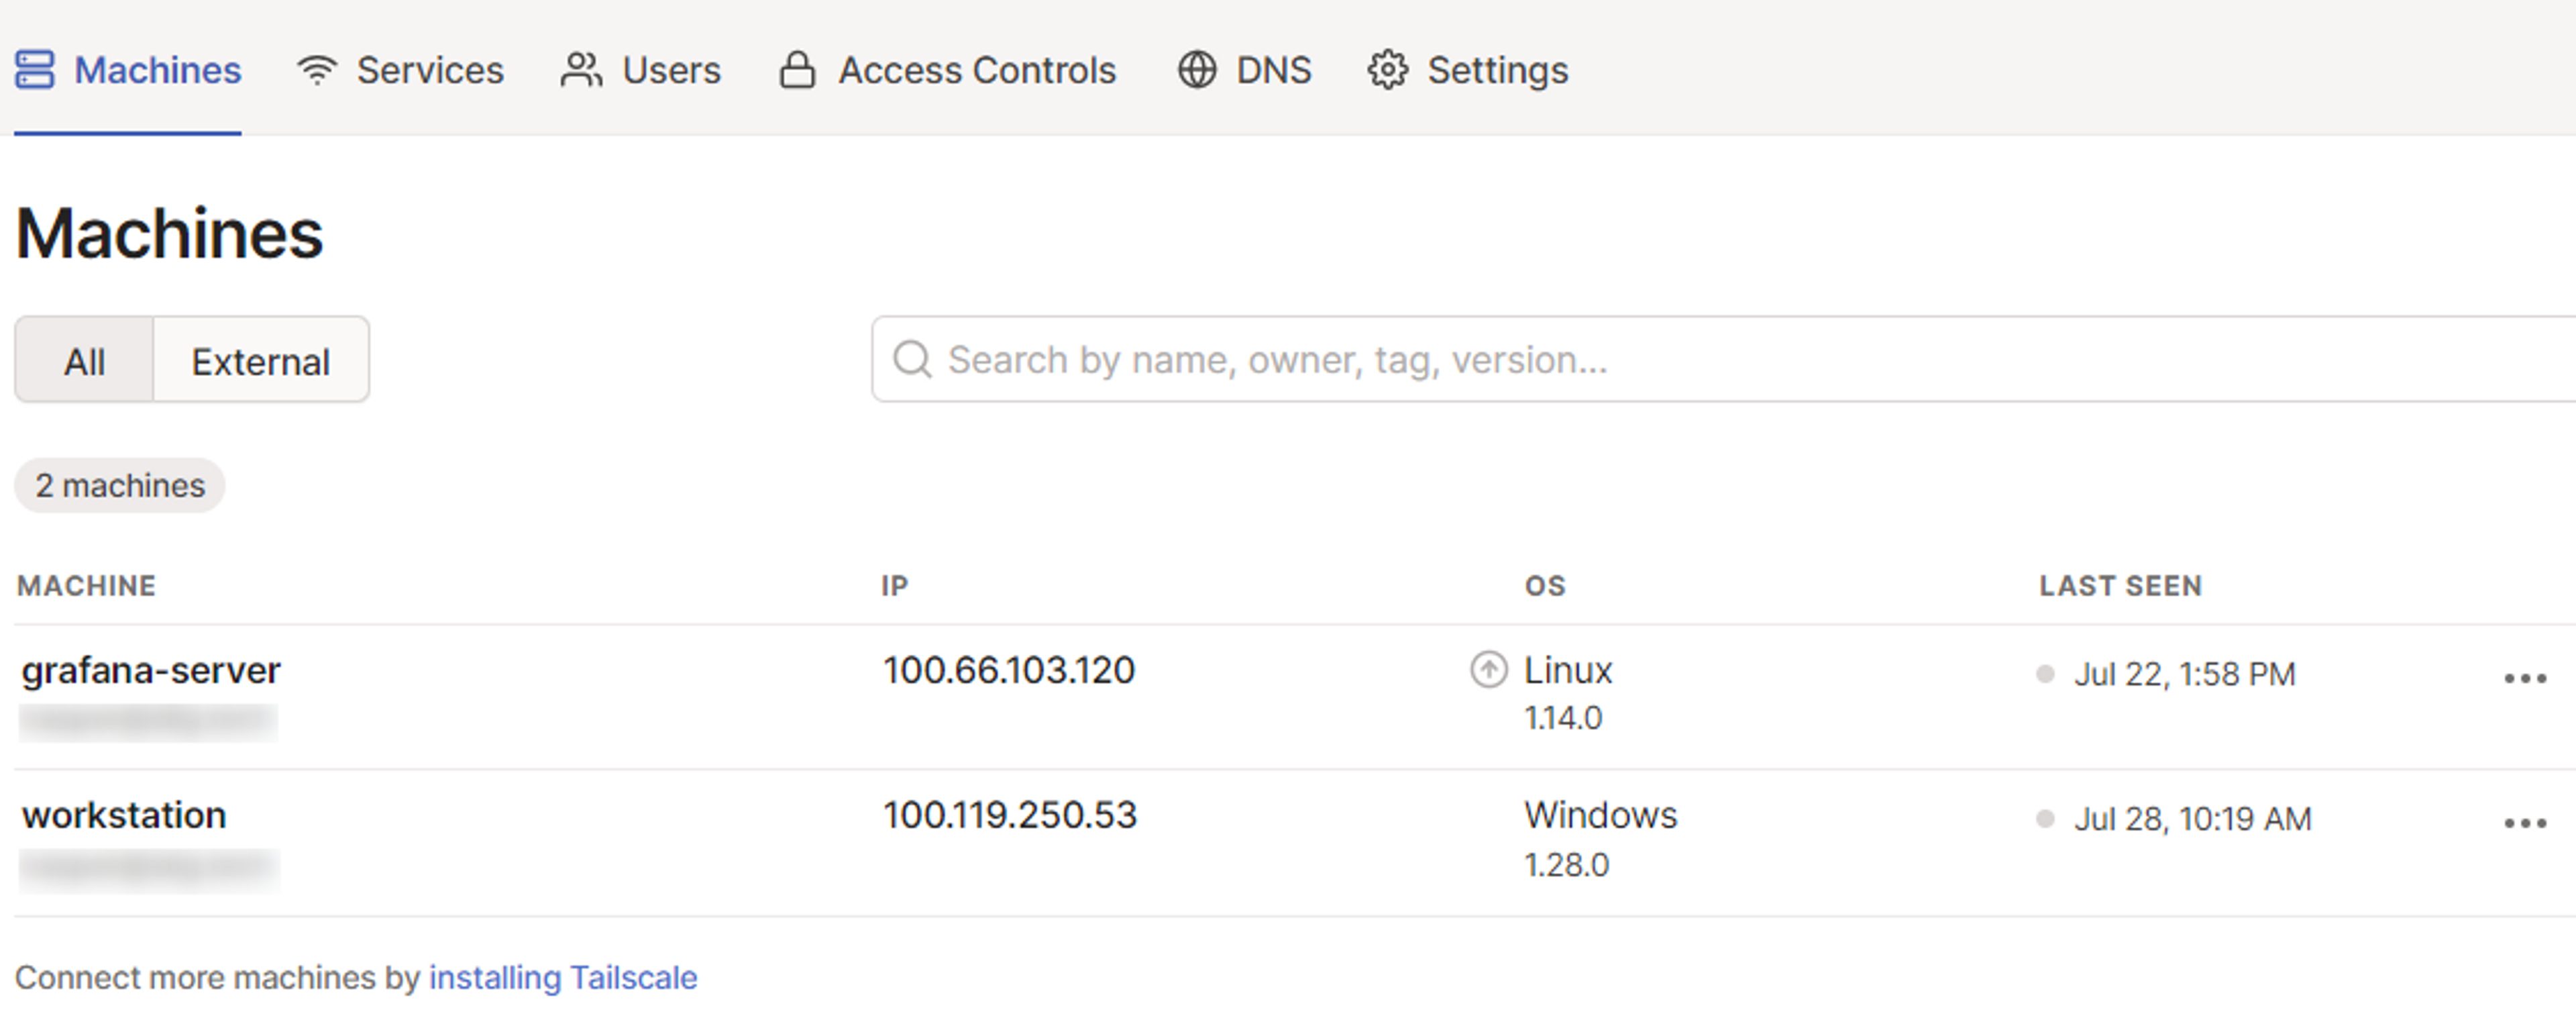
As you can see, the Grafana server has a Tailscale IP. You won’t be able to access the Grafana instance over the public internet, as it’s only available over your Tailscale network. To access it, you need to install Tailscale on your local machine. This process differs slightly depending on what platform you’re using, but regardless of the platform, the installation only takes a few clicks.
Once you’ve gotten Tailscale installed and connected locally, you should see your device pop up on the admin console. From there, you can copy the IP address of your Grafana server and navigate to <ip>:3001 in your browser to access your Grafana instance. Because it’s running over Tailscale, the Grafana instance knows exactly who your user is when you hit <ip>:3001, as Tailscale already authenticated your user before loading the page. So there’s no need for an additional Grafana login page. Instead, you should see your Tailscale user logged into Grafana. Similarly, if another user on your Tailscale network accesses Grafana, they’ll see their own profile logged in.
That’s how easy it is to get started with Tailscale. From here, you can begin managing access to your instances with ACLs to grant access as necessary — for example, if only your engineering team needs access, you can configure ACLs to grant access to Grafana only to them. Not only is your Grafana instance not exposed to the public internet, but you can easily lock down access even within your network. Additionally, you can configure Tailscale to create domain names for all internal devices.
Conclusion
No matter what type of infrastructure you have or what type of applications you’re running, it’s important to have easy and secure access to your metrics.
In this article, you’ve seen two possible solutions for this problem. One, using inlets, creates a public server and creates a tunnel between that server and your local machine; the other, using Tailscale, creates a new private network that lets you manage access to your service via ACLs.
Using Tailscale offers a number of advantages. Setup and configuration are easy and secure by default, allowing anyone to set up a secure network in a matter of minutes. By creating a private network, you ensure that your Grafana dashboard is private at all times, while tools like inlets will expose your services to the public internet. Finally, it’s able to protect far more than just your Grafana dashboard — you can effortlessly secure every device on your network.
FAQs
Why do you need to have secure access to Grafana?
According to the principle of least privilege, best practices include granting people access to only those resources that they need to do their job, and nothing more. Sharing Grafana dashboards without securing and limiting access increases the chances that data will be misused.
Can you share Grafana with users not in your Tailscale network?
By sharing your nodes, you can share your Grafana device with another tailnet, then use ACLs to lock down their access to just the Grafana instance on that device.
Does Grafana let you manage permissions on individual dashboards?
Yes! For a thorough rundown on managing Grafana dashboard permissions, see Grafana’s in-depth guide.


